
With ExDViewer, we’re making the analysis and visualization of peptide and protein MS/MS data intuitive, adaptable, and widely accessible.
ExDViewer provides MS1 and MS2 deconvolution of CID, ECD, ETD, EThcD, and other fragmentation data. It is designed specifically to enable convenient and collaborative interpretation of complex spectra.
Accelerate method development with real-time analysis
On Agilent Q-TOF systems, spectral streaming in ExDViewer enables real-time result feedback during instrument acquisition.
Annotate all ion types
Choose any combination of protein fragment ion types — b, y, c, z, a, x — for comprehensive sequence coverage.
Assign d, w side chain losses to clearly resolve I/L and isoD/D isobars.
Compare structure hypotheses to spectral data with confidence
Input a target peptide or protein sequence hypothesis to confirm against your spectral data.
The uniquely interactive interface is designed for quick navigation of big-picture results, while retaining the ability to directly interrogate individual ion assignments.
Simplify spectra with rapid deconvolution
At the click of a button, switch between profile, de-charged, and de-isotoped spectral views to simplify congested data.
ExDViewer supports both MS1 and MS2 deconvolution.
Standardize your analysis with a “parameter-free” approach
Reduce the time cost imposed by adjusting parameters for processing and analysis with ExDViewer, where default parameters are generally appropriate for both peptides and intact proteins.
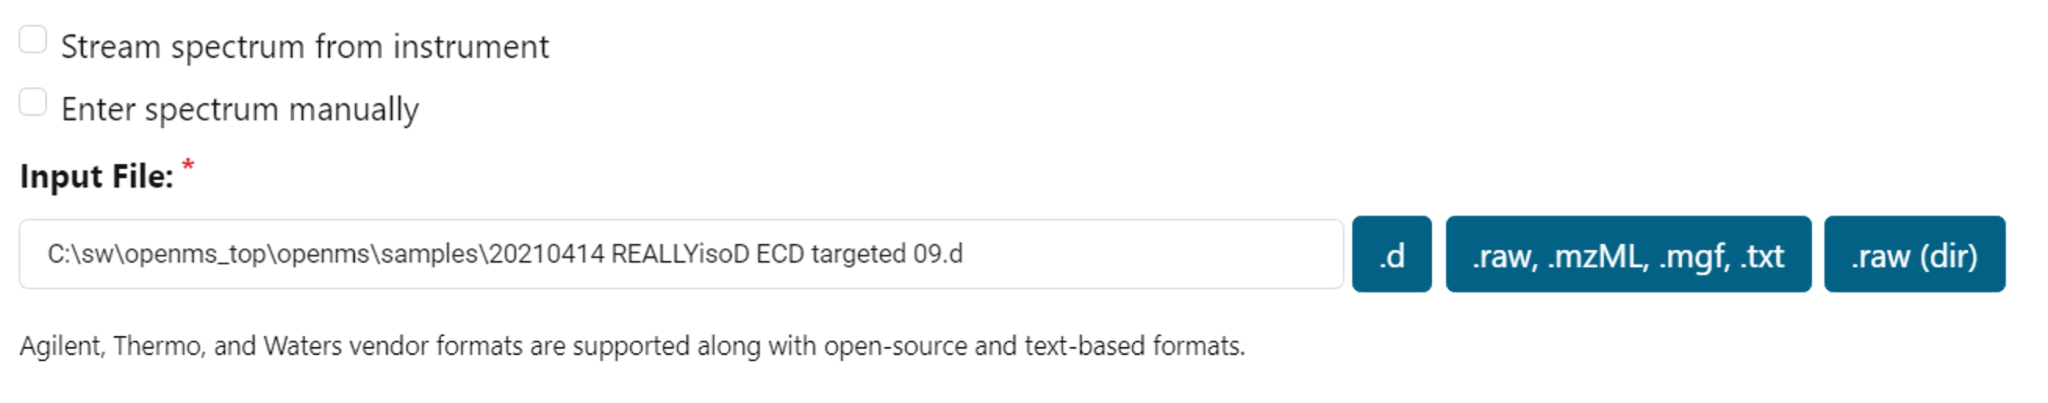
Break data barriers
ExDViewer accepts data from various vendor-specific and non-specific formats: Agilent .d, Waters and Thermo .RAW, .mzML, .mgf, and other open-source text-based formats.
Collaborate via link sharing
Sharing impactful results has never been easier. Send a URL link of your results to accelerate cross-lab collaboration.
Videos
See ExDViewer in action with interactive web demos
Application
File
Sample Information
Subscribe to our mailing list to receive ExDViewer software news and updates!
You can unsubscribe at any time by clicking the link in the footer of our emails. See our Privacy Policy.
Questions? Contact betatesting@e-msion.com
